Documentation
Project Name: Alpha
🔴 The Core Problem
When a water pipe bursts or a power grid drops in Addis Ababa, reporting it takes forever. People have to make phone calls, give confusing landmarks for directions, or wait days for utility teams to figure it out. Because there's no visual proof or fast way to see where the crisis is happening, vital city resources get wasted.
🟢 Our Solution
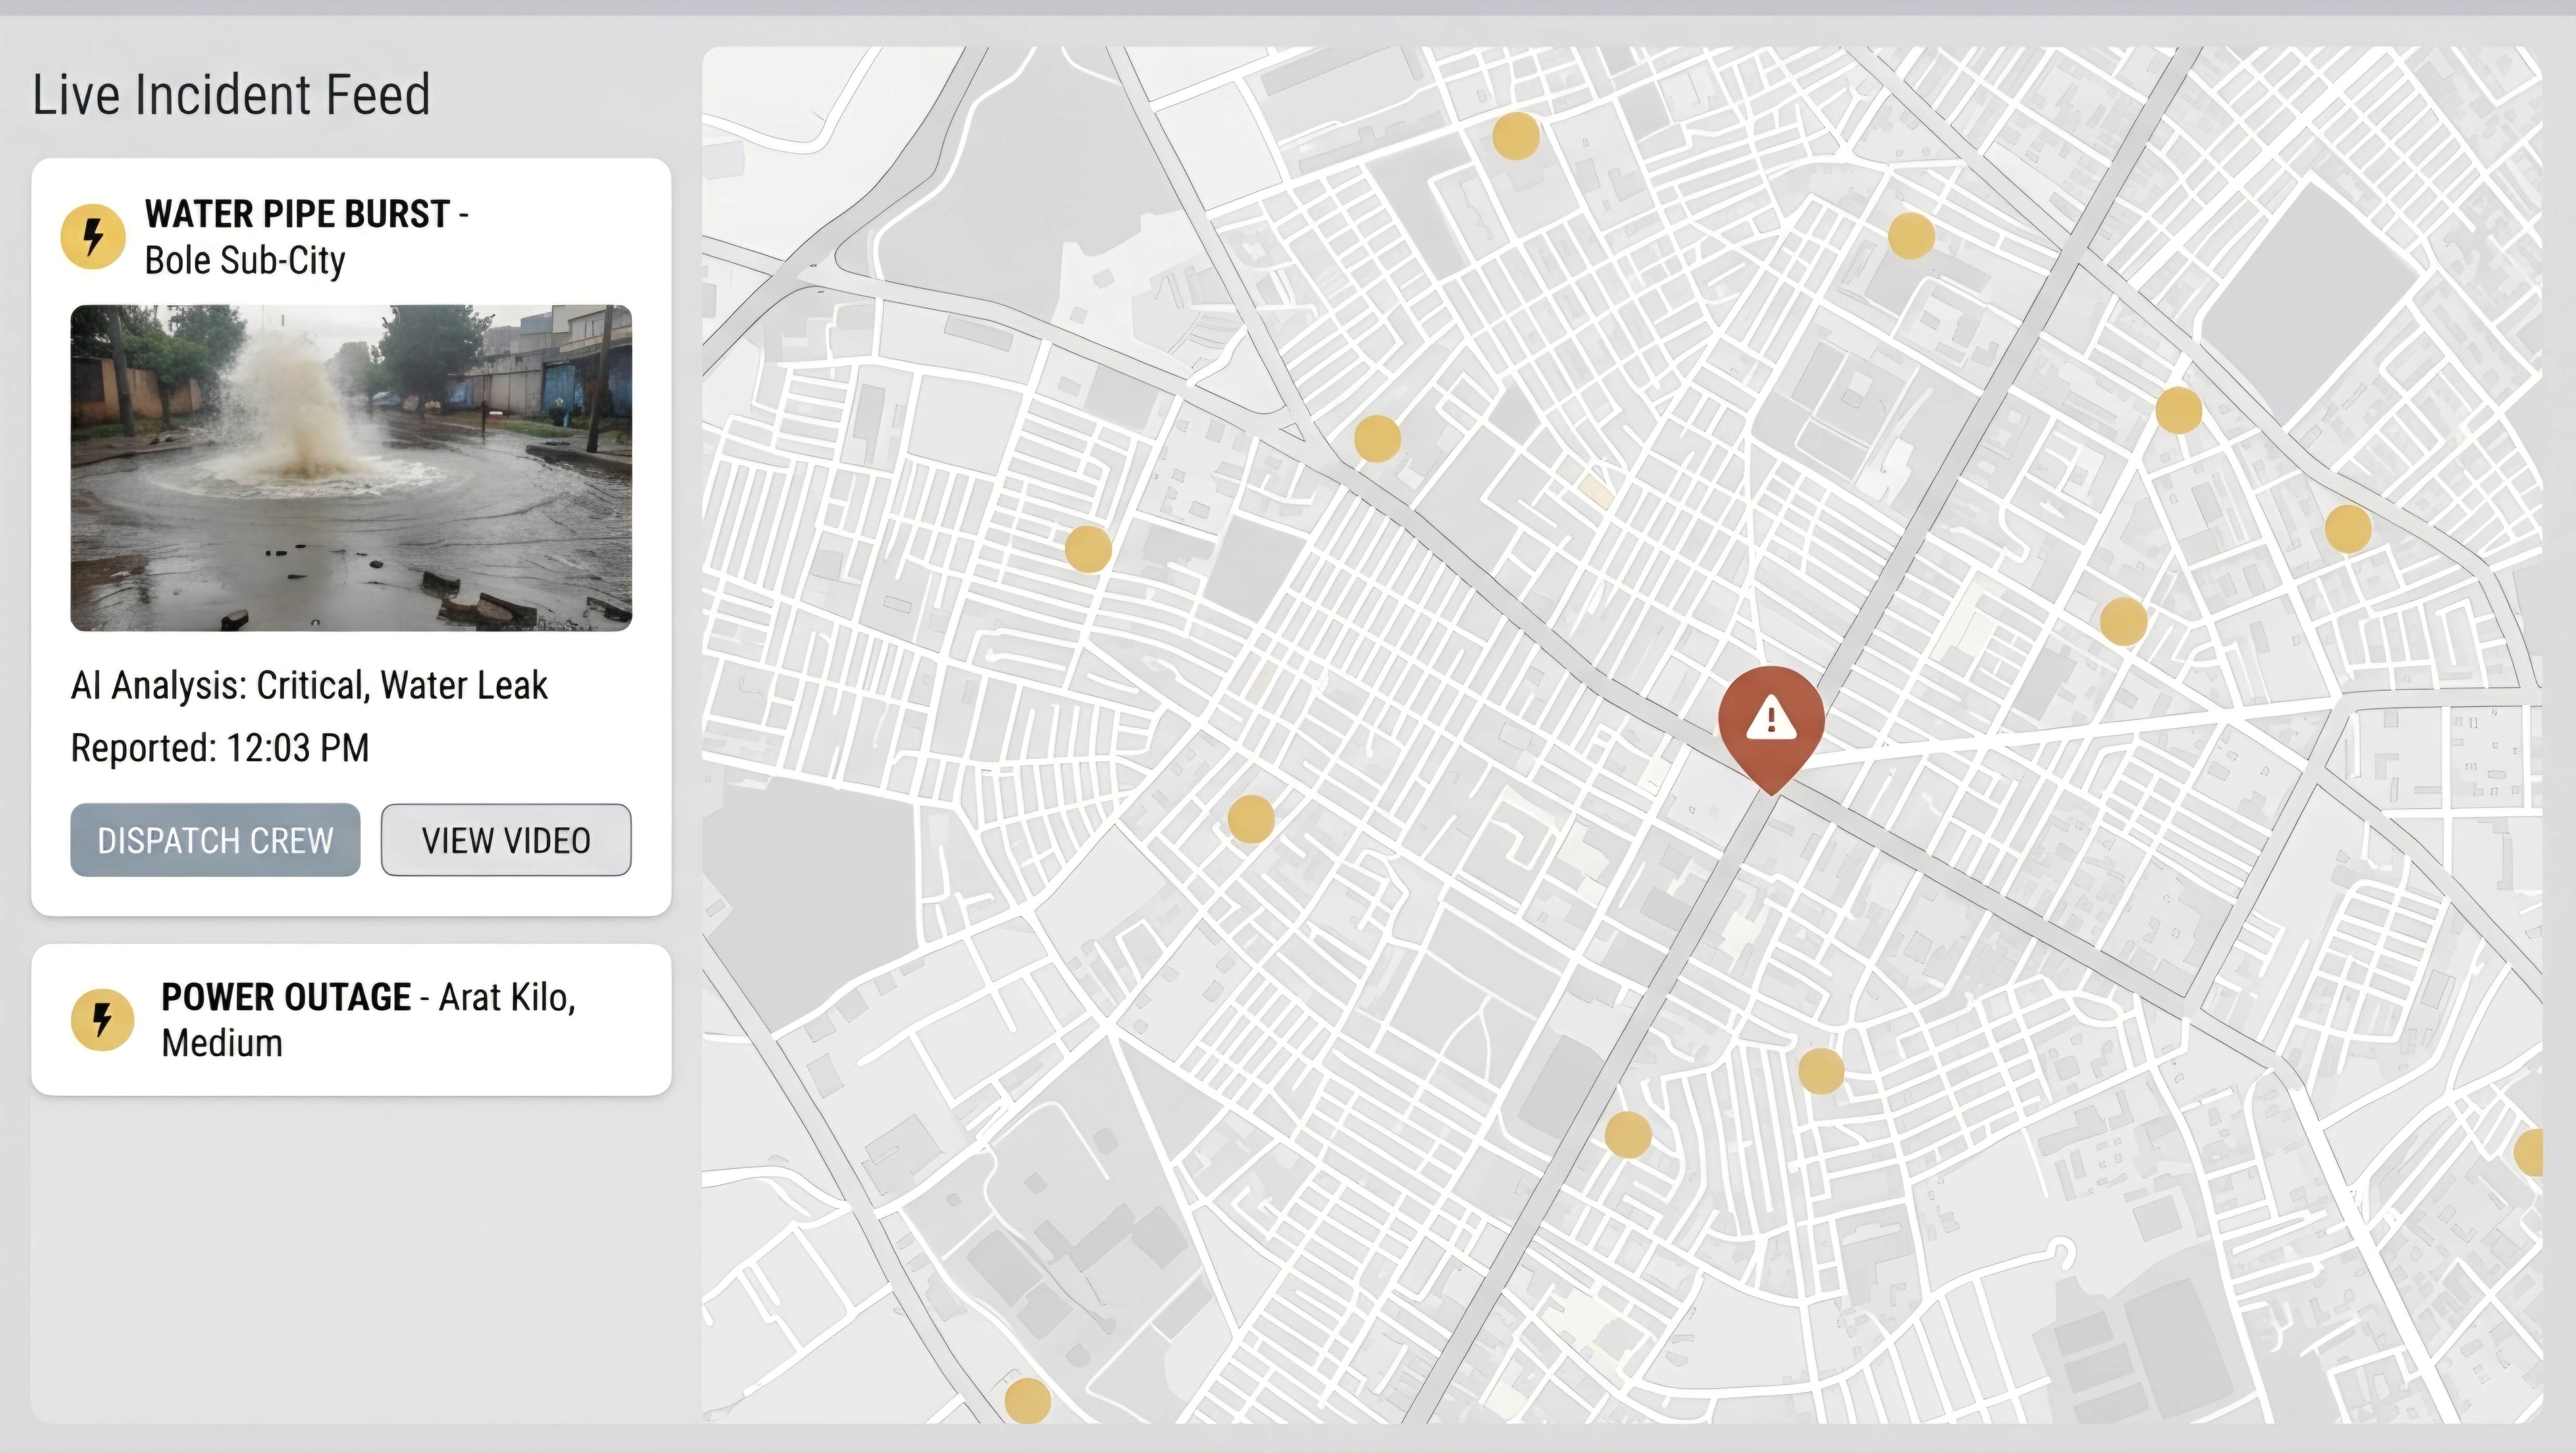
We built Alpha, an interactive, community-driven dashboard map that lets local residents pin-point and report infrastructure breakdowns instantly using video clips. Instead of an automated AI, we focus on real community mapping—utility dispatchers monitor a live view of the city, see exactly what needs fixing, and dispatch repair crews right away.
⚙️ How It Works (The Pipeline)
The Witness: A resident encounters a critical utility break (like a down power pole or massive street flood). They open the web app and upload a short video or picture proof of the live damage.The Telemetry: The application automatically grabs the user’s mobile GPS coordinates to attach an exact geolocation layer to the report.The Grid Map: The backend immediately creates an active, color-coded emergency marker (Red for Critical, Yellow for Medium) on a live interactive map dashboard for dispatch teams to cross-reference.
💻 The Tech Stack
Frontend: Built using React and styled with TailwindCSS to keep the interface clean, snappy, and lightweight on local mobile data. We integrated Leaflet.js to handle the live interactive mapping dashboard.Backend: Powered by a lightweight Node.js and Express setup that handles media storage routing, manages reports, and updates the map data in real-time.Hosting & Infrastructure: Deployed natively using EthioDeploy. Connecting our GitHub repository to EthioDeploy allows us to bypass complex server configurations and run a zero-setup production app that updates instantly whenever we push code. It hosts our code locally, triggers free SSL certificates, and handles platform traffic perfectly for local users.
